Venn and Euler Diagrams answer key
Venn and Euler diagrams - key to exercises
Most of the in-class exercises should be self-explanatory (but please speak up if they aren’t!). The one that may have given you trouble is the following:
Exercise 6: Write a function that allows you to generate a three-way Venn diagram without first manually calculating the sizes of the various groups and overlaps.
Hint: You will likely need to use functions described in the setdiff help page to do this.
Bonus point: If you can figure out how to write the function so that you don’t have to manually input the category names each time you run it, you get a gold star for the day.
threeway.Venn <- function(A,B,C,cat.names = c("A", "B", "C")){
  grid.newpage()
  area1 <- length(A)
  area2 <- length(B)
  area3 <- length(C)
  n12 <- length(intersect(A,B))
  n23 <- length(intersect(B,C))
  n13 <- length(intersect(A,C))
  n123 <- length(intersect(intersect(A, B), intersect(B,C )))
venn.plot <- draw.triple.venn(
  area1 = area1,
  area2 = area2,
  area3 = area3,
  n12 = n12,
  n23 = n23,
  n13 = n13,
  n123 = n123,
  category = cat.names,
  cat.pos = c(0,180,0),
  fill = c("blue", "red", "green"),
  alpha = .3,
  lty = "blank",
  cex = 2,
  cat.cex = 2,
  cat.col = c("blue", "red", "green")
)
grid.draw(venn.plot)
}
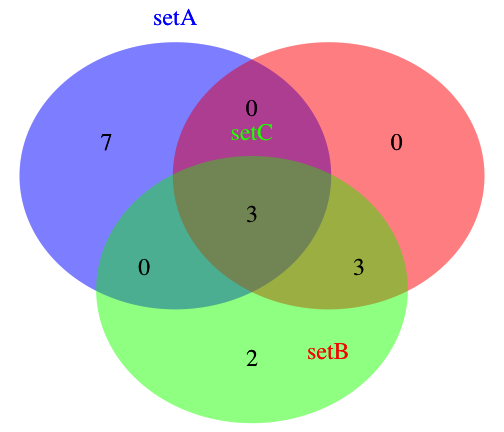
An example of a plot made with this function
library(VennDiagram)
## Loading required package: grid
setA <- 1:10
setB <- 8:13
setC <- 8:15

threeway.Venn(setA, setB, setC, cat.names = c("setA", "setB", "setC"))
Exercise 7:
Make what you think will be some interesting comparisons. Generate Venn diagrams to visualize the overlaps between different groups. Find two groups that have an overlap that you suspect is either greater than or less than you’d expect to happen by chance.
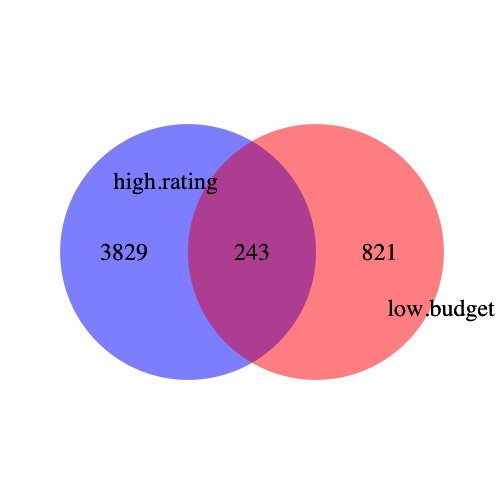
The below example is taken from the ‘movies’ dataset; I looked at the overlaps of movies with low budgets and high ratings.
library(ggplot2)

low.budget <- subset(movies, budget < 150000)$title
high.budget <- subset(movies, budget > 2.5e+07)$title
length(low.budget)  #1064
## [1] 1064
high.rating <- subset(movies, rating > 8)$title
low.rating <- subset(movies, rating < 2)$title
length(high.rating)  #4072
## [1] 4072
length(intersect(low.budget, high.rating)) #243
## [1] 243
grid.newpage()
venn.plot <- draw.pairwise.venn(area1 = 1064, area2 = 4072, cross.area = 243,
    scaled = F, category = c("high.rating", "low.budget"), fill = c("blue",
        "red"), alpha = 0.3, lty = "blank", cex = 2, cat.cex = 2, cat.pos = c(285,
        105), cat.dist = 0.09, cat.just = list(c(-1, -1), c(1, 1)), ext.pos = 30,
    ext.dist = -0.05, ext.length = 0.85, ext.line.lwd = 2, ext.line.lty = "dashed")
grid.draw(venn.plot)
We can test the statistical significance of this overlap using Fisher’s exact test.
The size of the universe is 58788 movies. I defined 1064 as low budget. I defined 4072 as highly rated. The overlap between the two sets (movies both highly rated and low budget) is 243. We’ll use the Fisher Exact Test to see if that is a greater overlap than expected by chance.
movie.matrix <- matrix(c(243, (1064 - 243), (4072 - 243), (58788 - 4072 - 1064 +
    243)), 2, 2, dimnames = list(set = c("low.budget", "not.low.budget"), class = c("high.rated",
    "not.high.rated")))

fisher.test(movie.matrix)  # p-value < 2.2e-16
##
## 	Fisher's Exact Test for Count Data
##
## data:  movie.matrix
## p-value < 2.2e-16
## alternative hypothesis: true odds ratio is not equal to 1
## 95 percent confidence interval:
##  3.582 4.832
## sample estimates:
## odds ratio
##      4.166